Chapter 4 Missing values
In this section, we will look at the patterns in missing data. We expect to have many missing values in this Mobile App User Dataset as the data are collected from a survey where respondents may skip questions that they prefer not to answer.
4.1 Column pattern
## PriceSensitive      Education       YearsEdu     Occupation         Gender
##           7104           4892           4892           4892           4842
##            Age    Nationality       AppStore
##           4842           4842           2310
Here, we define PriceSensitive as people who took price into consideration when choosing apps to download (those who chose Price in Q9). On the other hand, NAs in this column represent people who skipped the question or those who didn’t choose Price for the question. In addition to 7,104 missing values in PriceSensitive, 4,892 people didn’t reply to education, years of education and occupation, while 4,842 values are missing for gender, age and nationalities. It also shows that 2,310 people skipped the question of “which app store do you use?” in the survey.
4.2 Value patterns
4.2.1 Missing values by app store
## # A tibble: 11 x 7
##    AppStore        Gender   Age Nationality Education YearsEdu Occupation
##    <fct>            <int> <int>       <int>     <int>    <int>      <int>
##  1 iOS                106   106         106       113      113        113
##  2 Do not use apps     24    24          24        24       24         24
##  3 Blackberry          28    28          28        35       35         35
##  4 Android            167   167         167       181      181        181
##  5 Nokia              102   102         102       105      105        105
##  6 Samsung             76    76          76        80       80         80
##  7 Windows             23    23          23        23       23         23
##  8 None              1595  1595        1595      1595     1595       1595
##  9 Not sure           390   390         390       403      403        403
## 10 Other               21    21          21        23       23         23
## 11 <NA>              2310  2310        2310      2310     2310       2310
When we group the data by different App stores, some missing data appear to be highly correlated: Gender, Age and Nationality share the same patterns of missing values, while Education, YearsEdu and Occupation have exact same numbers of NAs in each App store. This shows that respondents who didn’t answer education-related questions also skipped the one for occupation. People who prefer not to answer their genders and ages avoided answering nationalities too.
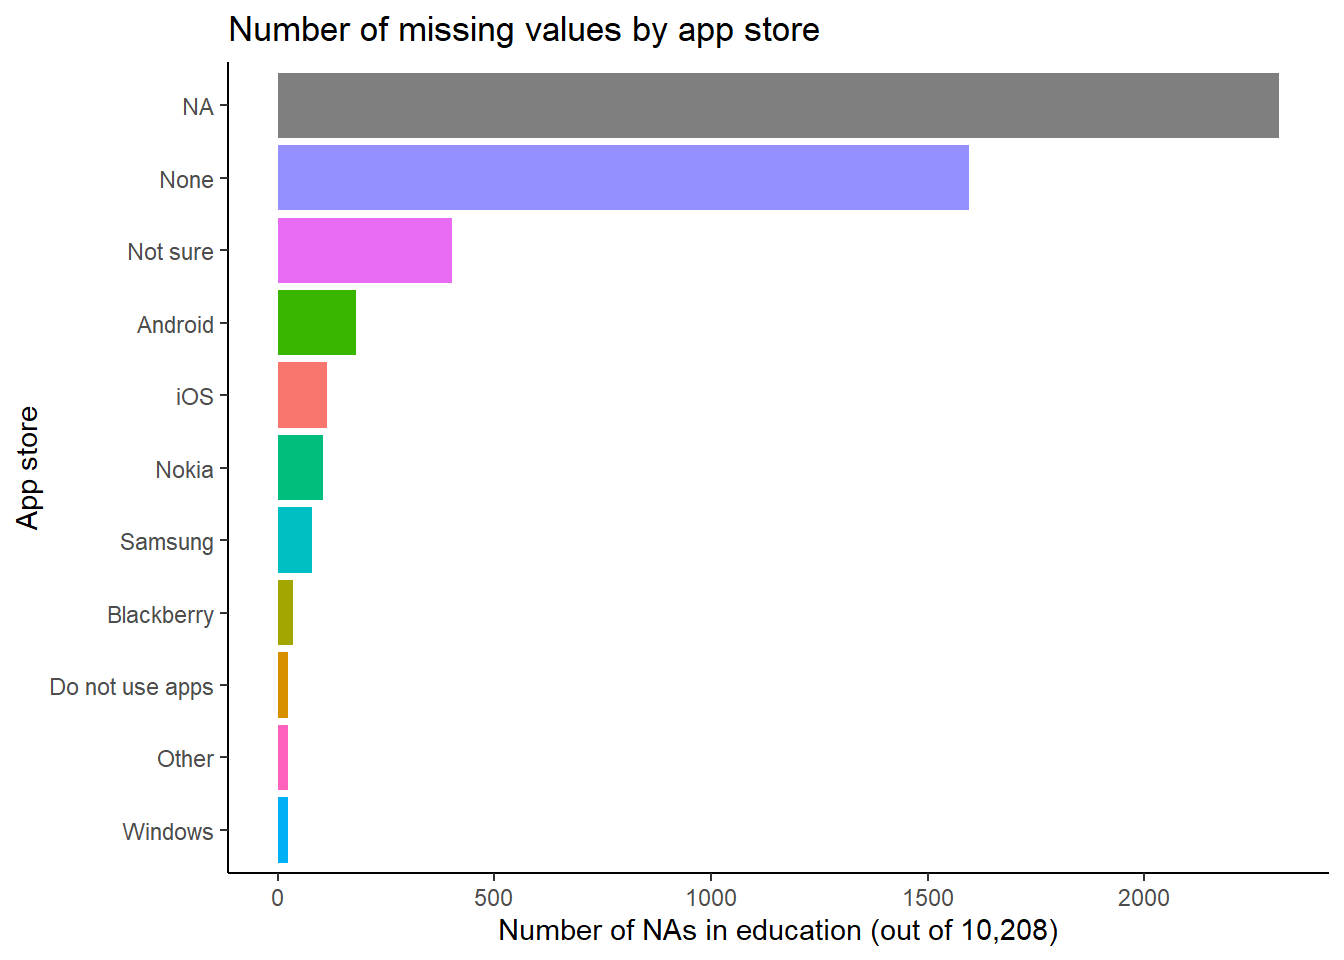
If we visualize missing values of Education by App store, we can see that the largest number of NAs in education appears in the group NA in App store. We should consider removing these NAs since they have little information for both variables.
4.2.2 Missing values by app store & price sensitivity
## # A tibble: 11 x 4
##    AppStore        num_appstore num_na pct_na
##    <fct>                  <int>  <int>  <dbl>
##  1 <NA>                    2310   2310   1
##  2 None                    1653   1633   0.99
##  3 Do not use apps           76     67   0.88
##  4 Not sure                 737    608   0.82
##  5 Nokia                    830    438   0.53
##  6 Other                    150     78   0.52
##  7 Samsung                  722    357   0.49
##  8 Android                 2066    990   0.48
##  9 Windows                  162     72   0.44
## 10 iOS                     1169    428   0.37
## 11 Blackberry               333    123   0.37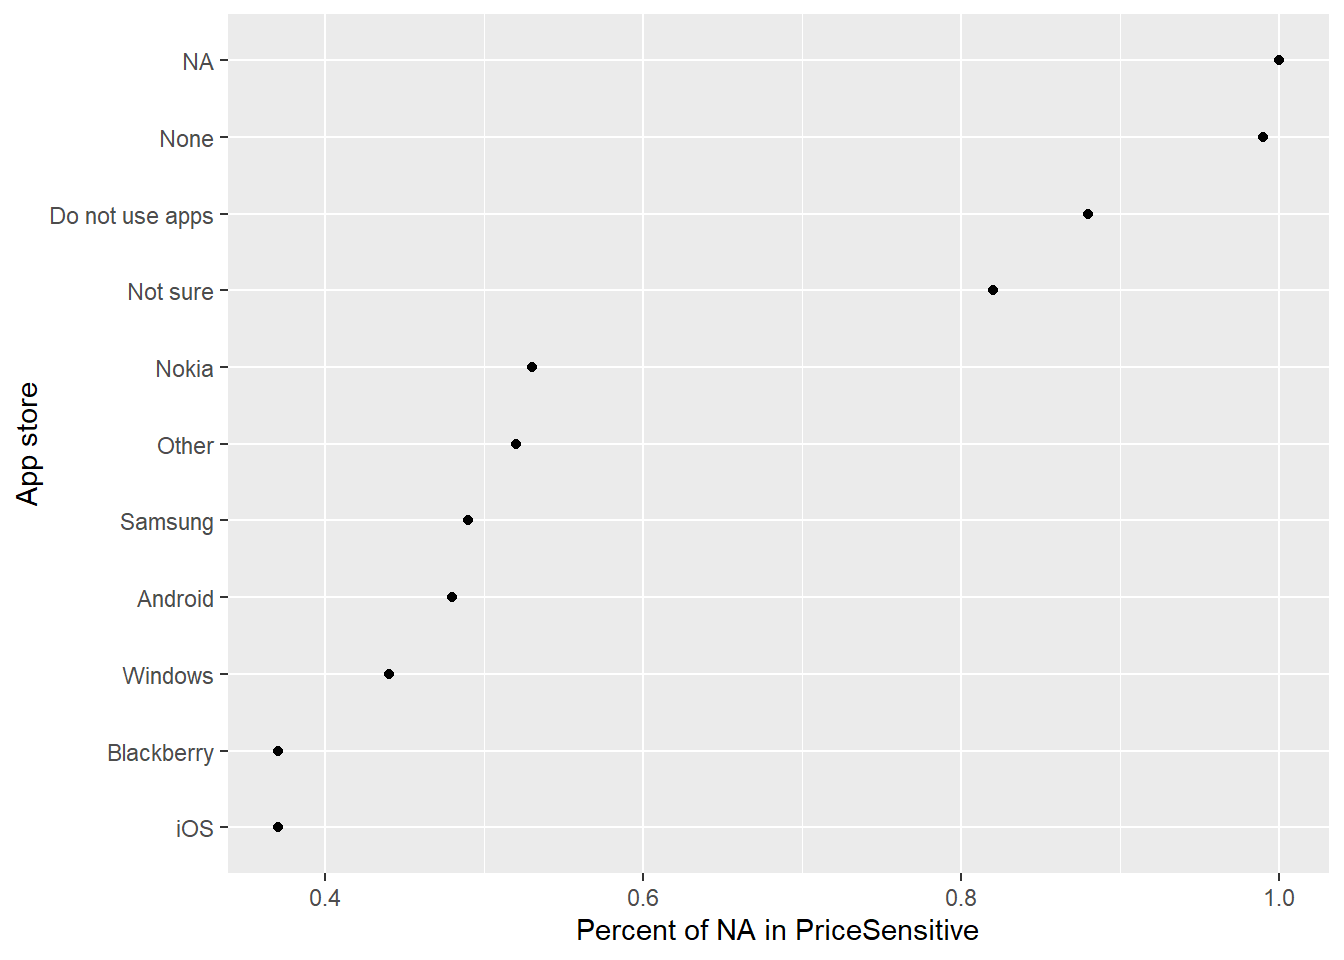
All people who skipped writing down their App stores have an NA in PriceSensitive. People using iOS (Apple Store) appear to have the smallest number of missing values for the price question, so they are the most price-sensitive. We can also see that Android/Google and Samsung market users have similar percentages of NAs.
4.3 Missing values by variable
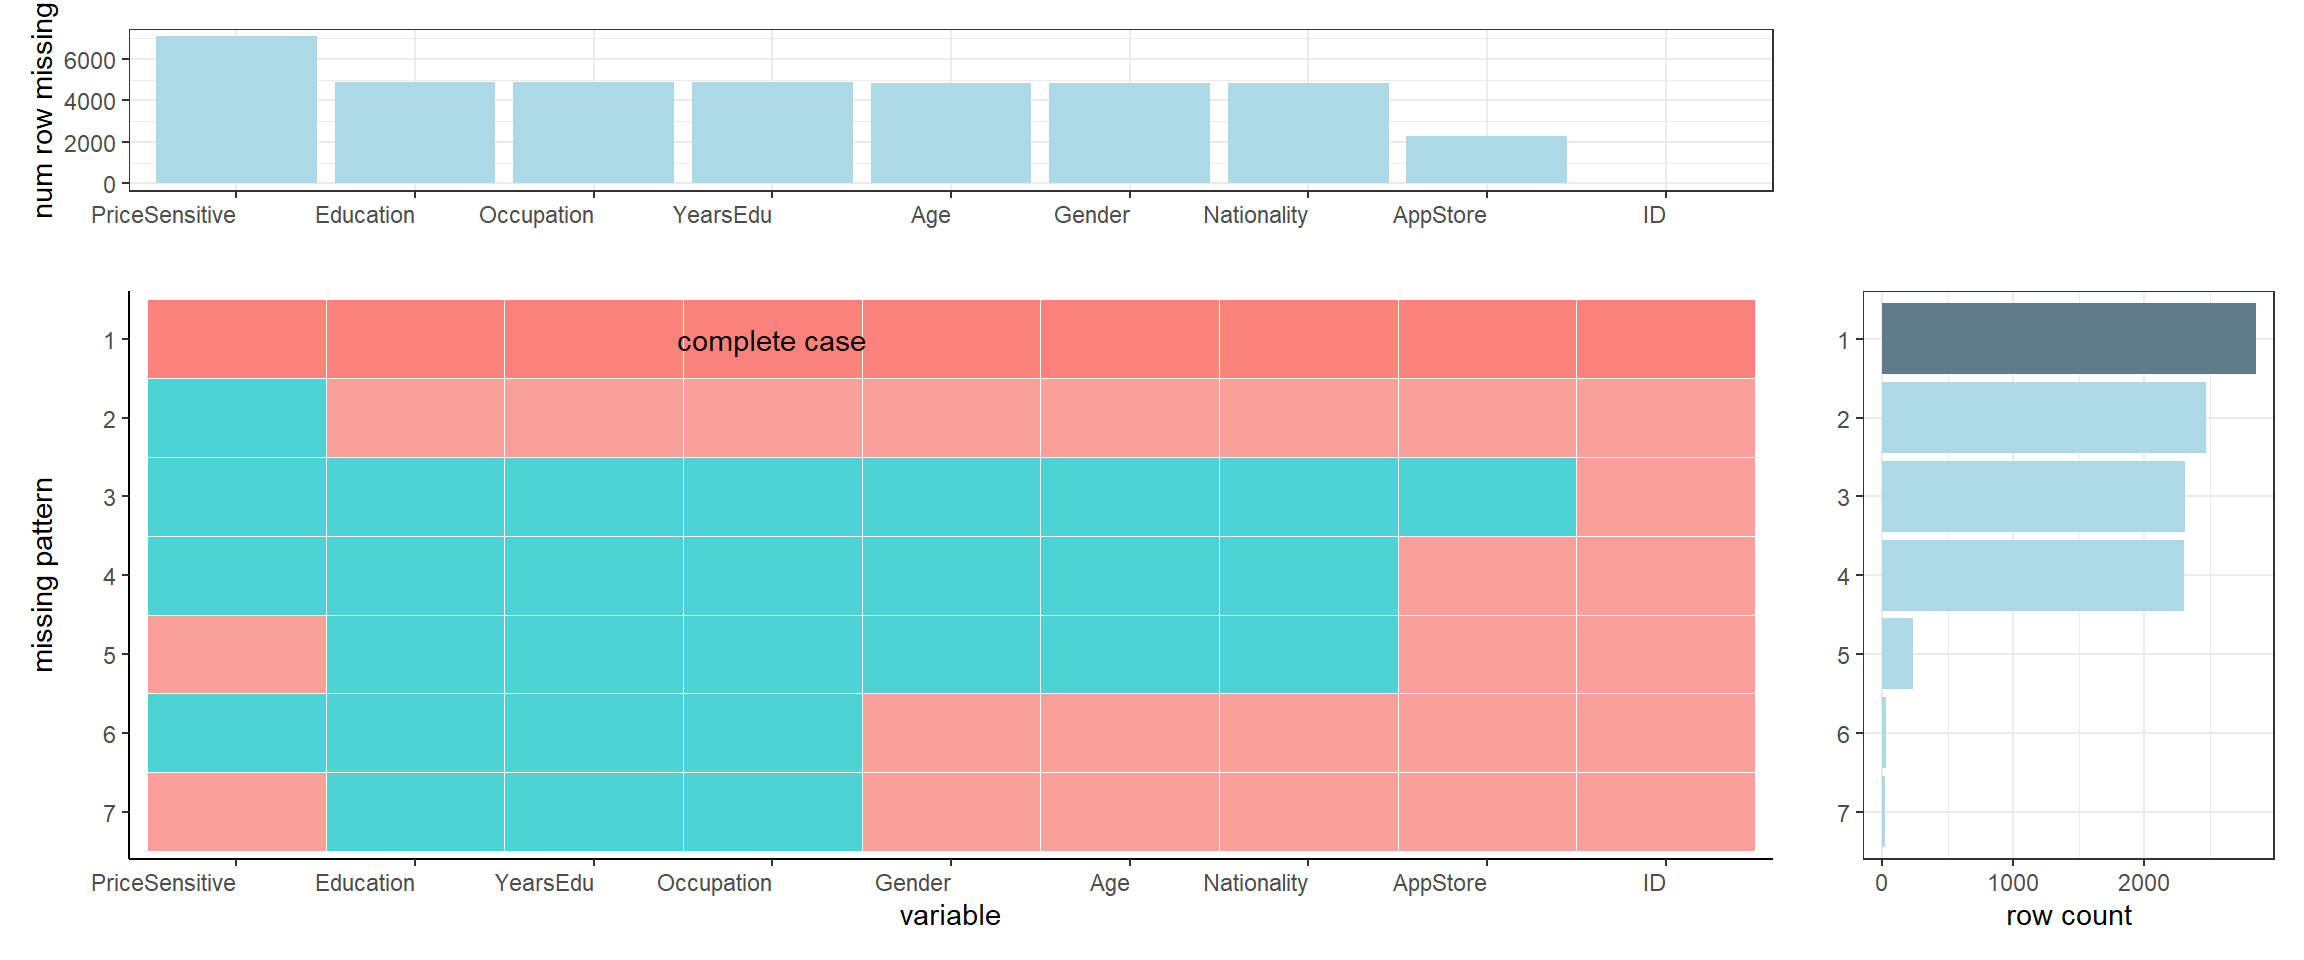
The most obvious pattern is the complete case (no NA in any column), indicating that over 2,500 observations contain all the information we need. The second most frequent missing pattern appears in the PriceSensitive column. It is interesting that many people didn’t provide any of their personal information in the survey, as we can see from the third, fourth & fifth patterns.